Skills you’ll Learn
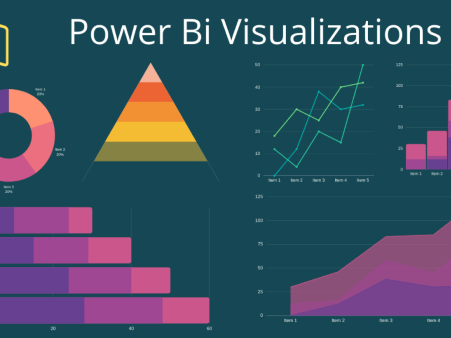
Data Visualization
Power BI
Components of Power BI
Visual Analytics

Data Visualization
Power BI
Components of Power BI
Visual Analytics
This Power BI course with certificate aims to unravel the complexities of Business Intelligence (BI) and equip you with the ability to craft impactful visualizations. This course provides a solid foundation, starting with a basic understanding of BI, the importance of Data Visualization, and an introduction to key tools. Delve into the core of Power BI, learning about its essential components, the architecture, and the powerful Data Analysis Expressions (DAX) for dynamic data manipulation.
This Power BI course offers practical learning through hands-on experience with the Power BI installation, navigating its interface, and mastering visual analytics. Whether you’re new to data visualization or looking to enhance your skills, this Power BI free course is designed to give you a deep dive into creating meaningful visual data representations. Enroll in this free Power BI course and take a significant step towards mastering Power BI, complete with a certificate to showcase your newfound skills.


Omowumi –
“This course was excellent for learning Power BI! The instructor explained complex concepts clearly and concisely, and the hands-on exercises really helped solidify my understanding. I feel confident in my ability to create impactful and informative visualizations now.”
Obi –
“This course was fantastic! The instructor explained complex concepts clearly and concisely, making Power BI data visualization accessible and easy to understand. The hands-on exercises were extremely helpful in solidifying my understanding, and I now feel confident in my ability to create insightful and impactful dashboards.”
Ebere –
“This course, Data Visualization With Power BI, was fantastic! The instructor explained complex concepts clearly and concisely, and the hands-on exercises really helped solidify my understanding. I now feel confident in my ability to create compelling and informative dashboards using Power BI. It’s definitely boosted my data analysis skills.”
Dupe –
“This course on Data Visualization with Power BI was excellent! The instructor clearly explained complex concepts and provided practical examples that helped me quickly learn how to create impactful visualizations. I particularly appreciated the hands-on exercises that allowed me to practice my skills and build my confidence. The course content was well-organized and easy to follow, and I now feel equipped to leverage Power BI for my data analysis needs.”
Iliya –
“This course on Data Visualization with Power BI was excellent! The instructor explained complex concepts in a clear and concise manner, and the hands-on exercises were incredibly helpful for solidifying my understanding. I now feel confident in my ability to create impactful and informative dashboards using Power BI. The course content was well-structured, relevant, and directly applicable to real-world scenarios.”
Zahrau –
“This Data Visualization with Power BI course was excellent! The content was well-structured, easy to understand, and provided practical examples that I could immediately apply. I learned a lot about creating compelling and insightful dashboards, and I feel confident in my ability to use Power BI to analyze and present data effectively.”